How to understand the changes in the domain name market?
Verisign & Afnic report, understand and interpret the figures covering the year 2019 - 2020!

Knowing how the domain name market is evolving is essential when it comes to understanding this industry. Known to be a fast moving sector, we will study in this article the different reports of the registries Verisign, Afnic and EURid.
The aim will be to question the results in order to understand what they reveal about the evolution of the domain name market.
Generally speaking, the results for the first quarter of 2020 show promising figures. Indeed, in comparison with the year 2019, we can see an increase in the number of domain names registered annually. Which TLDs are participating in this rise of registrations? Why are some unknown TLDs considered to be leaders in the domain name market? Explanations to follow!
– TLD: Top Level Domain is the technical name of the extensions.
– ccTLD: Country Code Top Level Domain includes two-character extensions which correspond to countries.
– gTLD: Generic Top Level Domain is a generic extension of 3 characters and more corresponding to a sector of activity, acronyms, etc.
– ngTLD: New Generic Top Level Domain includes gTLDs launched at the end of 2013 with the .شبكة (which means “.web”, and is translated as “.shabaka”). They come in opposition to the Legacy which are the .com .net etc …
Note that ccTLDs, gTLDs & ngTLDs are all sub-categories of the TLD family.
The .COM, a ubiquitous extension on the domain name market
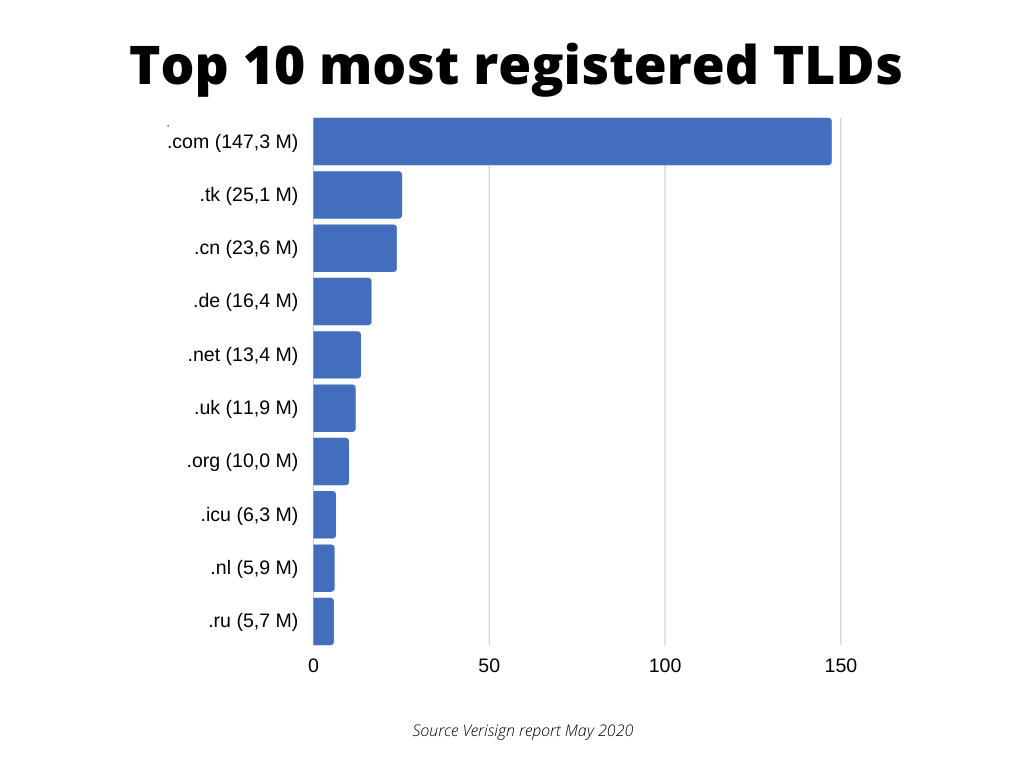
No need to introduce this extension which is everywhere on the Internet. It has a 40.15% share of all domain names registered worldwide. And before 2013, this extension held nearly 50% of the market, which means that 1 domain out of 2 was in .COM.
One would think that this high density and the complexity of finding an available .COM would discourage people from choosing this extension, but this is not the case. Or at least, this is not shown in the figures.
Thus, we note a 4.47% increase in the registration of .COM in the first quarter of 2020 compared to the first quarter of 2019.
Given these results, it seems undeniable that a .COM domain remains a preferred solution for many holders. Whether for international projects, a recognized visibility, the .COM keeps on rising. It should be noted that, due to this predominance, many domains are not available for registration. This explains the emergence of new specialized extensions such as ngTLDs.
The ngTLDs are all the rage… or working with great marketing techniques…
As explained earlier, the broad dominance of the .COM on domain name registration sometimes makes it difficult for holders to register domain names. Indeed, if your company’s name is relatively common, there is little chance that your .COM domain name will be available (for example, no more variations between 1 and 5 characters are available, and the same goes for generic terms). This is why many ngTLDs have appeared in the last few years. These extensions are virgin land and all the domain names are available.
They are mostly descriptive extensions and have a strong marketing interest: .wine , .shop , .contact , .paris, etc,.
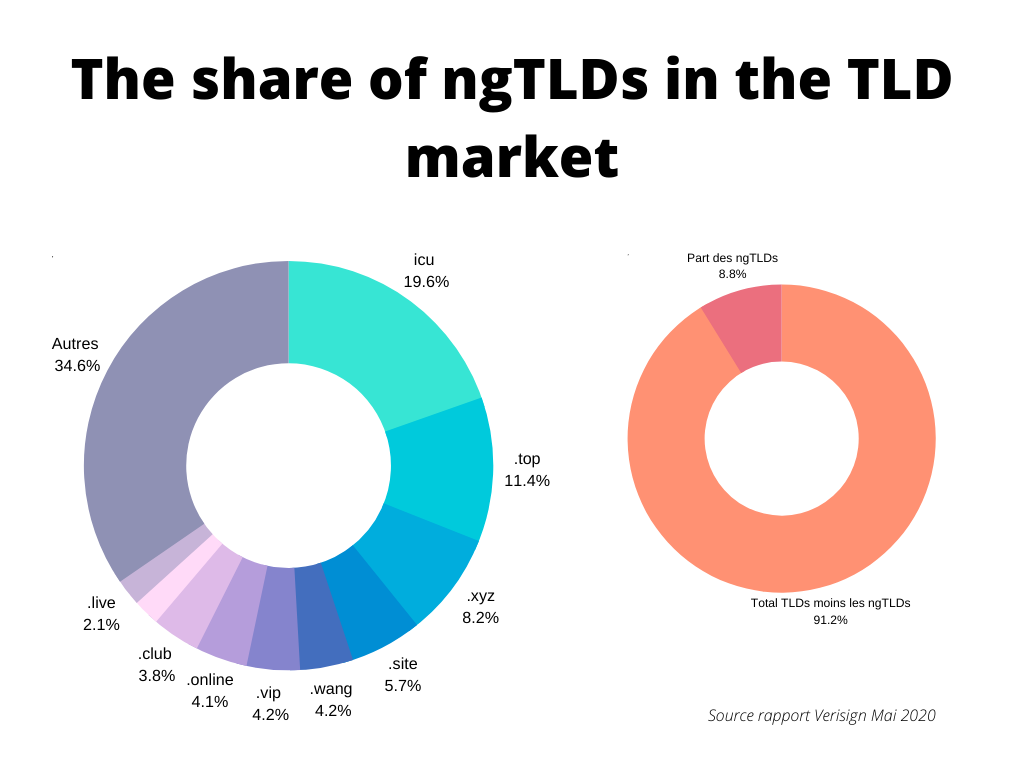
If we compare the market share of these new extensions to the total number of registered domains, we can see that it is still a considerable figure. In fact, 8.8% of registered domain names are registered with one of these new extensions. That is an increase of almost 40% between 2019 and 2020.
If we study these figures more closely, we notice that the three most popular ngTLDs are: the .icu (19.6%), the .top (11.4%) and the .xyz (8.2%).
Focus on the 3 most popular ngTLDs
The .xyz model
As shown on the graphs above the most popular ngTLDs are: .icu / .top and .xyz. How can we explain such an ascension?
To sum up, these 3 extensions have the same economic model. This model was initiated by Mr. Daniel Negari who is none other than the CEO of XYZ (the company managing the .xyz extension). In short, the principle is to offer a permanent ” discount ” for $1 or less. Such a low price attracts many users. The profit for the registry is made at renewal time. Indeed, the renewal remains at a “normal” price around $8.
The math is simple, if 1 million domains are registered at $1, that makes a revenue of $1 million. However, if 100,000 domains are sold at $8, the profit is less. Especially if we consider that the renewal rate is never equal to 100%. With the logic of an attractive price and a “normal” renewal, even if a part of the holders decide not to renew, there is still an interesting volume with a renewal price 8 times higher than the registration rate.
So even if this renewal percentage is only 10% of the users, it still represents 100,000 domains or $800,000 … understand the process? It’s exactly the same with .icu and .top.
The .icu & .top answer
The .icu and .top tested, via punctual discount, if the .xyz model could be applied to their extension. If we study the curves of these extensions, we can see peaks during the discount and lows during renewals, one year later.
Since the market response has been positive, they have been displaying a permanent “discount” price and have far overtaken their mentor regarding the amount of domain names registered.
The question remains : how many are actually used in real projects? Ask yourself the question: “How many advertisements, articles or websites have you ever seen communicating on one of these 3 extensions when they hold more than 13 million domains”?
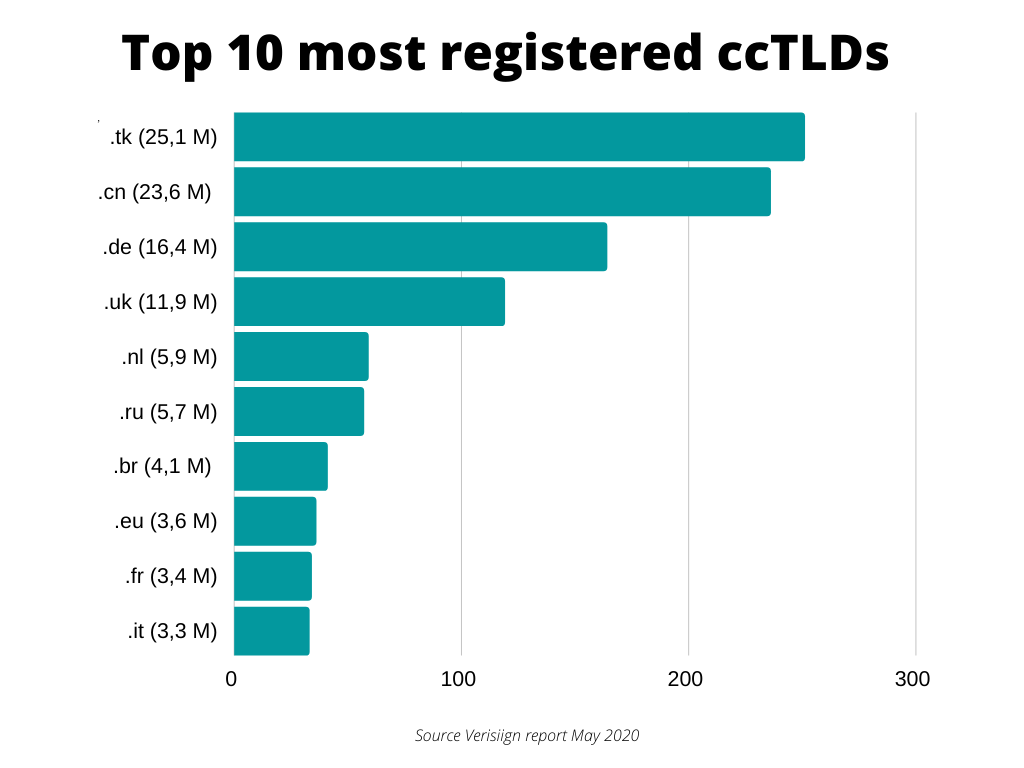
ccTLDs represent a considerable share of the domain name market (38%). Of course, each one is specific to a country. Therefore, it is logical that their market shares are less important than international extensions such as .COM. Moreover, it is also logical that .CN (China) is among the most widely represented ccTLDs. There is, in fact, a correlation between commercial market shares and domain name market shares.
We can see that the top 10 ccTLDs (out of 307 existing) represent 65.4% of the total market.
Nevertheless, some extensions such as .TK (Tokelau archipelago) are in first position. How can we explain these disparities?
A special case: .TK (Tokelau)
How can the national extension of a small archipelago in the Pacific Islands be the 2nd most used TLD worldwide? Indeed, just behind the .COM, you can find the .TK.
Of course, there is a rational explanation. Indeed, it is not just because of its 1,400 inhabitants that the 25.1 million domains have been registered. In fact, it is an opportunity seized a few years ago by a Dutch entrepreneur, Joost Zuurbier, to market this extension for free. Note however that there are two ways to acquire a .TK, either for free and at that time you are not the owner of the domain, or by buying it like any other extension. This entrepreneur has decided to extend this practice to other extensions such as .ML / GA or .CF.
Thus, all over the world, .TK domains are flourishing. And, even if this business decision leaves the door open to many malicious practices (phishing, spam, malware, etc.) for many years, the people of Tokelau have benefited from this business. In 2006, the profits from the sale of their national extension represented 1/6 of the GDP (.tk charges trademarks and domains with less than 4 characters).
Focus on 2 ccTLDs: .UK & .EU
These are two extensions that are typically representative of ccTLDs. The United Kingdom national extension (the .UK) and the European one (the .EU). In the ranking of the most used ccTLDs, these two extensions are respectively in fourth (.UK) and eighth (.EU) position.
It is interesting to note that the dynamics in terms of growth of ccTLDs depend entirely on regions and local consumption habits. Europe, for example, has the largest number of high-volume ccTLDs. For example, the share of ccTLDs in the European domain name market is 62%, compared to 40% as the world average.
This is explained in particular by the predominance of .DE (Germany). With its 16.4 million registered domains, the .DE ranks fourth in the world in terms of the most used extensions. Beyond this Germanic dynamic, it is clear that Europeans are attached to their national extensions.
Thus the .EU loses 0.1 million and still maintains its place in the ranking of the most used ccTLDs. The .UK, on the opposite, was gaining a lot of registrations throughout 2019. As noticed it in the Afnic report, in one year only, 1 million .UK domains were registered. This growth puts the .UK in first position regarding the variation pourcentage (+8.7%).
IDNs, a major challenge for the domain name industry
What is an IDN (internationalized domain name)?
Originally a domain name is a sequence of characters allowing any user to access an IP address. By translating a sequence of characters into an IP address, the user’s process is simplified and navigation is more fluid. Originally, the allowed characters were limited to ASCII characters a – z and 0 – 9.
In the year 2000, in a logic of linguistic diversity, it was decided to internationalize the authorized characters to non-Latin characters, in particular to the Arabic, Cyrillic, Greek and Asian alphabets. This decision still raises many technical issues.
Since 2017, the number of IDNs has increased by 20%. This reveals a growing share of extensions accepting these types of characters. Despite this, IDNs only represent a tiny proportion of the total number of domain names (2.5%).
In addition, China alone has more than 3.9 million IDNs among this number, making it the leading consumer of internationalized domain names.
How should these results be interpreted?
It goes without saying that the challenge is huge. And the universal acceptance of non-Latin alphabets is far from being achieved. This disparity raises the question of linguistic diversity. Many studies prove that being able to communicate, visit sites and seek content in one’s own language promotes the development of a local digital culture.
There are therefore real challenges in the development of internationalized domain names.
The final word!
If there is one thing we can take away from these statistics, it is that the domain name sector is growing steadily from year to year. The predominance of .COM and other international TLDs is unequivocal. The European market is the one in which the national extensions are the most widely registered, thanks in particular to Germany.
As for the ngTLDs, their growth is predicted to be exponential but can be put into perspective. Marketing techniques can, in some cases, distort the figures reported by the registries.
The growth of IDNs is present, in spite of real challenges to come. But, faced with a booming Asian market, and particularly the Chinese one, no one could doubt that the means are and will be put in place to make up for the lack of internationalisation of domain names.
Sébastien ALMIRON’s advice (Chief Sales and Marketing Officer at Netim) is simple:
“With so many extensions, you can’t register everything, so you should register your .COM, the extension(s) in which you are present (or plan to be present) as well as the new extensions that make sense for your business”